
Best Excel Add-ins for Data Analysis in 2026
Microsoft Excel has been the software of choice for data analysis for many years. From small businesses to large corporations, it remains an important tool for collecting, summing, and arranging data records.
But when data becomes too intricate, the built-in functionality of Excel may not be enough. This is where Excel add-ins come in, offering additional features to help with more demanding tasks. You may also come across them as add-ons in Excel or plugins, as these terms are often used interchangeably.
Overall, Excel add-ins help address common limitations, from repetitive data cleanup and manual calculations to reporting and visualization tasks that standard Excel features may not fully support.
Besides, if you’re looking to simplify financial analysis, build more sophisticated charts, or add AI-driven insights, there’s probably an add-in that suits the task.
Today, we’ll present you with our picks for the best Excel add-ins for data analysis and productivity in 2026, cover data visualization tools in Excel, and explain when you might want to consider custom Excel add-in development services.
How to Choose the Right Data Analysis Excel Add-in
Choosing the right Excel add-in can make your work way easier and help you get more done in less time.
Still, with so many options out there, it’s important to pick one that matches your conditions and fits like a glove into your workflow. To make the best choice, there are a few key things to keep in mind.
Begin by thinking about the elements you lack. Do you want to automate redundant chores, draw up more detailed charts, or run advanced data processing?
The right extension should give you the mechanisms to do that without making things more complicated, not the other way around.
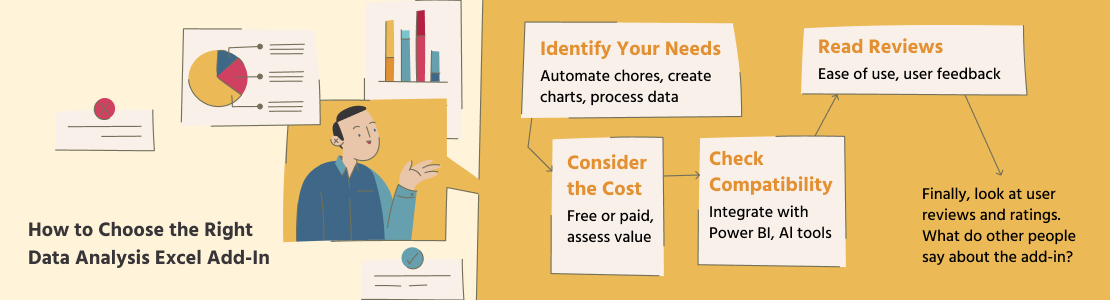
Flowchart Outlining Steps for Selecting the Right Excel Add-in
Next, check if the add-in can connect to other platforms/systems/applications you use, e.g., Power BI or AI-based platforms. This will help you avoid the hassle of moving Excel data back and forth manually.
Third, you shouldn’t overlook the price. Some extensions are free, others may charge a recurring fee. Before paying for one, however, ask yourself if the features are truly worth the cost. Many add-ons let you try them for free, so you can experiment first.
Finally, look at user reviews and ratings. What do other people say about the add-in? Is it easy to use, practical, and well-supported? Reviews always give a good idea of what to expect.
Top 12 Excel Add-ins for Data Analysis and Productivity
Extensions for Excel tasks can be of different types, designed for different tasks and challenges. Sometimes it seems that it is not easy to understand all this diversity.
Below, we’ve listed twelve of the best add-ins in 2026, including two AI add-ins for Excel explaining what each one does and what pros and cons to consider.
1. Power Query – Best Tool for Data Cleaning and Transformation
What It Does: Power Query is a built-in Excel tool that can also function as an add-in in older Excel versions. It simplifies the process of importing, cleaning, and transforming data from various sources.
Key Features:
- Import data from multiple sources (SQL, CSV, etc.)
- Automate repetitive tasks
- Create advanced data transformation workflows
Pros: Saves time on data preparation, strong integration with Power BI
Cons: May have a learning curve for beginners
Best for: Anyone importing and reshaping data from multiple sources on a recurring basis.
2. Solver – Best for Optimization Problems
What It Does: Solver is an optimization tool that helps users find the best possible solution for various decision-making scenarios, such as maximizing profits or minimizing costs.

Key Features:
- Linear and nonlinear optimization
- Constraint-based problem solving
- Integration with VBA for automation
Pros: Great for financial modeling and logistics optimization
Cons: The built-in Solver has limits on problem size and complexity
Best for: Financial analysts, supply chain managers, and researchers
3. XLSTAT – Best for Statistical Analysis
What It Does: XLSTAT is a powerful statistics add-in for Excel designed for academic researchers, data scientists, and business analysts. It adds advanced statistical capabilities directly to Excel.
Key Features:
- Regression analysis, clustering, and factor analysis
- Time series forecasting
- Visualization of statistical data
Pros: Wide range of statistical tests, user-friendly interface
Cons: Expensive compared to other Excel plugins
Best for: Researchers and data scientists
4. Ablebits – Best for Data Management
What It Does: Ablebits simplifies data cleaning and management tasks, making it easier to remove duplicates, split cells, merge data, and more.
Key Features:
- Duplicate remover
- Cell splitting and merging tools
- Data validation checks
Pros: Easy to use, excellent for large datasets
Cons: Paid version may be costly for casual users
Best for: Business users handling large spreadsheets
5. ChatGPT for Excel – Best for Natural-Language Spreadsheet Automation
What It Does: Official add-in from OpenAI that brings an AI assistant into Excel’s sidebar. Users can create and update spreadsheets, generate formulas, clean data, and analyze existing workbooks using natural-language prompts.
Key Features:
- Builds and updates formulas from natural-language prompts
- Runs scenarios based on existing cells and formulas
- Cleans and restructures data on request
- Shows a preview before any change is applied
Pros: Supports Excel and Google Sheets; available across supported ChatGPT plans
Cons: Usage limits depend on the ChatGPT plan; AI-generated changes require review
Best for: Teams wanting one natural-language AI across Excel and Google Sheets.
6. Kutools – Best for Time-Saving Utilities
What It Does: Kutools for Excel offers over 300 utilities designed to enhance productivity. From combining sheets to converting data formats, it covers almost every repetitive task within Excel.

Key Features:
- Sheet management tools
- Data transformation utilities
- Advanced find and replace options
Pros: Great time-saver for repetitive tasks
Cons: Some features may be redundant for advanced users
Best for: Power users who need to optimize their Excel workflows
7. PHStat – Best for Basic Statistical Analysis in Excel
What It Does: PHStat enhances Excel’s statistical functions, making it easier for beginners to perform essential analyses. It is published by Pearson and comes with its statistics textbooks, such as Statistics for Managers Using Microsoft Excel.
Key Features:
- Hypothesis testing
- Descriptive statistics
- ANOVA and regression tools
Pros: Simple and beginner-friendly
Cons: Not as advanced as XLSTAT
Best for: Students and those new to statistical analysis
8. Claude for Excel – Best AI Excel Add-in for Finance Models
What It Does: An official AI assistant add-in from Anthropic, installed from Microsoft Marketplace. It works as a sidebar in Excel that understands your spreadsheet’s structure and formulas.
Key Features:
- Understands workbook structure, formulas, and named ranges
- Cleans and restructures data on request
- Explains and debugs existing formulas
- Builds multi-step financial models from natural-language prompts
Pros: Strong at multi-tab, formula-heavy analysis; shares context with Claude for PowerPoint and Word
Cons: AI-generated formulas and calculations require manual verification
Best for: Teams already using Claude who want deeper spreadsheet and model analysis than Copilot provides.
9. Atoti – Best for Real-Time Data Handling
What It Does: Atoti provides an Excel add-in that connects spreadsheets to Atoti Server for real-time analysis. Users can refresh PivotTables as data changes, explore detailed records, and work with multidimensional datasets.
Key Features:
- Real-time OLAP cube analytics
- Custom dashboards
- Fast calculations on large datasets
Pros: Excellent for real-time data aggregation
Cons: Requires an Atoti Server environment and additional setup
Best for: Organizations already running Atoti/ActiveViam who want that data surfaced in Excel
10. Stock Connector – Best for Tracking Live Stock Data
What It Does: Stock Connector brings live stock prices, exchange rates, and other financial data directly into your Microsoft Excel spreadsheet.

Key Features:
- Live stock price tracking
- Customizable watchlists
- Automatic updates
Pros: Easy setup, broad financial instrument coverage, and automatic price updates
Cons: Real-time quotes and faster refresh intervals require premium access
Best for: Traders and analysts who need live market data inside their spreadsheets.
11. Analysis ToolPak – Best Free Built-in Tool for Data Analysis
What It Does: Analysis ToolPak is a built-in Excel add-in for statistical analysis, including regression, histograms, and hypothesis testing. It’s included with supported Excel editions at no additional cost but may need to be enabled before use.
Key Features:
- Regression analysis (simple and multiple)
- Histograms with customizable bins
- Descriptive statistics (mean, variance, standard deviation, etc.)
- ANOVA, t-tests, F-tests, correlation and covariance
- Moving average and exponential smoothing
Pros: Completely free, no extra installation, covers most everyday statistical needs
Cons: Interface feels dated; results are static snapshots, not live formulas
Best for: Students, analysts, and anyone who needs standard statistical tests without buying third-party software.
12. Inquire – Best Excel Add-in for Formula Analysis
What It Does: Spreadsheet Inquire compares two workbooks cell-by-cell, maps dependencies between formulas and sheets, flags broken links, and cleans up excess formatting.
Key Features:
- Workbook comparison with a visual diff report
- Interactive map of formula/cell relationships
- Detection of hidden sheets, broken links, and inconsistent formulas
Pros: Invaluable for auditing large or inherited spreadsheets
Cons: Available only in Excel for Windows with Microsoft 365 Apps for enterprise and equivalent qualifying editions
Best for: IT and finance teams auditing complex or inherited workbooks.
Comparison Table: Best Excel Add-ins for 2026
If you feel overwhelmed with information, the table below shows how the solutions compare at a glance.
| Add-in | Best For | Key Features | Free / Paid | Pros | Cons |
| Power Query | Data cleaning & automation | Data import, transformation | Free (built in) | Power BI integration, large datasets | May have a learning curve for beginners |
| Solver | Optimization problems | Linear/nonlinear optimization | Free (built in) | Ideal for finance & resources | Limits on problem size and complexity |
| XLSTAT | Advanced statistical analysis | Regression, clustering, forecasting | Paid (trial available) | Powerful, user-friendly | Pricey for casual users |
| Ablebits | Data cleaning & management | Remove duplicates, split cells | Paid (14-day trial) | Saves time on big datasets | Windows-only; paid license |
| ChatGPT for Excel | Natural-language spreadsheet automation | Formula generation, data cleaning, scenario analysis | Limited free access; plan-based usage limits and credits | Supports Excel and Google Sheets | Usage limits; AI output requires review |
| Kutools | Time-saving utilities | Combine sheets, data conversion | Paid (30-day trial) | Speeds up repetitive tasks | Some redundant features |
| PHStat | Basic statistics | Hypothesis testing, ANOVA | Comes with Pearson statistics textbooks | Good for beginners | Limited advanced tools |
| Claude for Excel | AI-assisted spreadsheet and financial model analysis | Formula debugging, workbook analysis, model creation | Paid Claude plan required | Strong multi-sheet analysis | Requires a paid Claude plan |
| Atoti | Real-time enterprise analytics | OLAP cubes, PivotTable integration | Paid | Fast for big data | Requires Atoti Server |
| Stock Connector | Live stock data tracking | Live stock prices, watchlists | Free + premium access | Simple setup, broad market coverage | Premium access for faster updates |
| Analysis ToolPak | Standard statistical analysis | Regression, histograms, descriptive statistics | Free (built in) | Free, built into Excel | Static outputs, limited advanced analysis |
| Inquire | Spreadsheet auditing | Workbook comparison, formula dependency maps | No additional cost with qualifying Windows editions | Useful for complex workbook audits | Limited to qualifying Windows editions |
Best Excel Add-ins for Data Visualization
Standard Excel charts cover most reports, but data visualization using Excel often needs more. These Excel visualization tools add chart types, diagrams, and maps that the standard chart gallery does not include, so you can present results in a clearer way.
ChartExpo for Excel — Best for Advanced Chart Types
ChartExpo for Excel adds chart types that the standard gallery does not offer, such as Sankey, Likert scale, and Gantt charts. It helps turn survey results and tabular data into visual reports inside the workbook.
Best for: Analysts who build presentation-ready charts from survey and business data.
Python in Excel — Best for Custom Statistical Plots
Python in Excel lets you build plots and charts with libraries such as Matplotlib and seaborn directly from worksheet cells. It suits statistical and exploratory charts that the standard gallery cannot produce. Availability depends on your Microsoft 365 plan.
Best for: Analysts who know Python and want custom charts inside Excel.
3D Maps — Best Built-in Tool for Geographic Data
3D Maps is built into Excel for Windows. It plots geographic data on a 3D globe or a custom map and can show changes over time as an animated tour.
Best for: Sales, logistics, and research data tied to locations.
Best Free Excel Add-ins
You don’t need paid software for every Excel analysis task. Several tools from our list are included with supported Excel versions, while others offer free trials or limited access.

The best free options depend on what you need to accomplish:
- Analysis ToolPak provides regression analysis, histograms, descriptive statistics, and hypothesis testing without additional charges. It works as a free data analysis plugin for Excel.
- Solver helps with optimization problems, such as minimizing costs or allocating resources within defined constraints.
- Power Query imports, cleans, combines, and transforms data from different sources. It’s particularly useful for recurring reporting tasks.
- Inquire helps compare workbooks, trace formula relationships, and identify spreadsheet issues. However, it’s only included in qualifying Windows editions, including Microsoft 365 Apps for enterprise.
Third-party tools offer other ways to get started. Ablebits Ultimate Suite provides a 14-day free trial with data cleaning and worksheet management features. Kutools for Excel offers a 30-day trial with access to its full toolkit. Both require payment for continued unrestricted use.
For routine analysis, Excel’s built-in tools are often sufficient. Paid add-ins become worth considering when you need specialized statistical methods, bulk processing, or functionality unavailable in your Excel edition.
Why Off-the-Shelf Excel Add-ins May Not Be Enough
Excel plugins are great for increasing productivity and manipulating data, but they are not always the best for everyone. Most off-the-shelf add-ins are intended for general tasks and may struggle with specialized calculations, industry-specific processes, or integration with internal systems. When comparing off-the-shelf vs custom add-ins, these requirements often determine whether a ready-made solution is sufficient.
Integration is another challenge. Companies may need to exchange data between Excel, CRM platforms, ERP systems, and internal databases. When an add-in doesn’t support the required connections, employees may have to transfer data manually, increasing administrative work and the risk of errors.
The work doesn’t always end in Excel. Financial figures and analysis results often need to appear in documents or presentations. The best Word add-ins can help with document preparation, while the best PowerPoint add-ins offer tools for charts, layouts, and reporting.
For businesses with specific technical requirements, developing Excel add-ins in C#, C++, and Python can provide more control over calculations, integrations, and data processing.
Another consideration is cost. Some commercial add-ins include numerous features that a company may never use. Paying for unnecessary functionality can make a custom solution worth evaluating, particularly when the same workflows are repeated across teams.
SCAND: Your Partner in Custom Excel Add-in Development
If off-the-shelf Excel add-on tools aren’t meeting your needs, SCAND is here to help. Our experienced team can create custom extensions that do exactly what you need—be it integrating Excel with your CRM or ERP, automating complex calculations, or adding advanced AI-powered features.

Unlike ordinary add-ons, our solutions will integrate with current workflows and process even the most demanding datasets without bogging down your Excel experience.
With over 25 years of software development expertise, SCAND has helped businesses in different fields optimize their work by delivering custom solutions that address business requirements.
Our add-ins are designed to be user-friendly, efficient, and scalable, so you get the exact features you need—without unnecessary extras or performance issues.
If you’re ready to take your Excel productivity to the next level, let’s talk! SCAND can develop a custom solution that’s fast, efficient, and perfectly suited to your business needs.
Frequently Asked Questions (FAQs)
What are the best Excel add-ins for data analysis?
The best Excel add-ins depend on your needs. Power Query handles data cleaning and transformation, while XLSTAT offers advanced statistical analysis. Solver helps with optimization problems, and Analysis ToolPak supports common statistical tests. For AI-powered tasks, ChatGPT for Excel and Claude for Excel can assist with formulas, data processing, and spreadsheet analysis.
Are there free Excel add-ins?
Yes. Power Query, Solver, and Analysis ToolPak are included in supported Excel versions at no additional cost. Inquire is available in certain Microsoft 365 and Office editions. Third-party tools such as Ablebits and Kutools offer free trials, while some AI add-ins provide limited free access or usage credits.
How do I install an Excel add-in?
In Excel, go to Home > Add-ins, find your tool in Microsoft Marketplace, and follow the installation steps. For built-in tools like Solver or Analysis ToolPak, go to File > Options > Add-ins, select Excel Add-ins, and click Go. For macros or VBA-based extensions, enable the Developer tab in Excel.
What is the difference between Excel add-ins and add-ons?
Excel add-ins, add-ons, and plugins generally refer to tools that extend Excel’s functionality. Microsoft officially uses the term add-ins. These tools can add statistical analysis, automation, AI features, or integration with other software. Some come built into Excel, while others are available through Microsoft Marketplace or third-party developers.
Can I get a custom Excel add-in for my company?
Yes. Custom Excel add-ins can automate calculations, connect spreadsheets to internal databases, CRM or ERP systems, and simplify reporting. They can also support company-specific workflows and security requirements. SCAND offers Excel add-in development services to help businesses extend Excel with features that standard tools may not provide.