Software development is always a race against time. A client postponed the deadline, testing revealed critical bugs, and the project team was in a rush for a week. All this happens because tasks live in heads, chats, and a bunch of separate files. No one can really see who is busy, what stages are slowing down the work, and when everything needs to be ready.
A Gantt Chart is a visual planning tool that shows task deadlines, their order, and progress in the form of horizontal bars to help manage the project and resources.

The main value of a Gantt Chart is its ability to turn abstract plans into a concrete work schedule. For example, without it, it’s easy to miss that a delay in API development automatically shifts testing deadlines, and an overloaded developer will not be able to meet the deadline.
With a diagram, these connections become obvious: if one task is stretched, you can see at a glance what other deadlines will follow. This is especially important in Agile projects where the plan is constantly being adjusted — the Chart helps to quickly reallocate resources without losing sight of the big picture.
Step-by-Step Guide to Creating a Gantt Chart for Software Projects
Let’s understand how to create a really useful Chart for your software project. It’s not just a pretty picture, but a working tool that will help you keep everything under control.
Define the Scope and Objectives
It all starts with your vision. What exactly do you want to create and why? It can be a completely new digital product or a revision of a current system. Your business goals and objectives are the starting point for all project work. The more clearly they are articulated, the more precisely we can plan timelines and prioritize.
It is important to understand the scope of the project: which features are critical for launch, and what can be implemented later. For example, if you are launching an online store, you should decide in advance whether the recommendation system will be included in the first version or will appear later. This will help you to avoid a proliferation of tasks and focus on what’s important.
Break Down the Project into Tasks
Now that the goals and functions are defined, we divide the project into logical blocks — each of which represents a complete business functionality: user registration, order placement, admin panel, etc.
Such detailing allows you to clearly see what the whole development process consists of and how these parts will be implemented step by step. It will also help you to control the project progress even without diving into technical nuances.
Assign Responsibilities and Set Deadlines
Together we define key deadlines — when you expect the first results, when you need an MVP or a demo version for investors. Based on this, we will build realistic planning, taking into account available resources and priorities.
Each task in the Gantt chart will be assigned an executor, and deadlines will be balanced against its workload. This gives you the confidence that the work is moving at the set pace and without overloading the team.
Choose a Reliable Software Provider
A reliable technology partner is the basis for a successful project. SCAND has been developing turnkey software for over 20 years and supports projects at all stages — from idea to implementation.
SCAND can develop a tool with a Gantt chart — either as part of a larger product (e.g., a project management system) or as a separate module. We already have experience in creating web-interfaces with interactive visualizations, including complex charts, timelines and task-tracking tasks.
Visualize Dependencies and Milestones
A Gantt chart not only shows how long certain milestones will take, but also how they relate to each other. If one task is delayed, it can affect the timeline of the entire project. We mark such dependencies in advance to avoid a “domino effect” in deadlines.
The diagram will also mark key milestones — points at which it is important to check against the plan: completion of a block, preparation for testing, launch of functionality. These stages allow you to correct the work progress in time, if something goes wrong.
Track Progress and Adjust the Plan
Once the project is started, the Gantt Сhart becomes your main monitoring tool. You will see not only what has already been done, but also which tasks are in progress, which are planned, and how much actual progress meets expectations.
If changes appear — for example, you decide to speed up the launch of a certain function – we flexibly rearrange the plan: reallocate tasks, shift priorities, adjust deadlines. A Сhart is not a once-and-for-all document, but a living project management tool.
Where are Gantt Charts Used?
From large-scale construction projects to marketing campaigns, Gantt charts help you manage projects in a wide range of industries. This visual planning tool turns complex processes into clear schedules, making it easy to control deadlines, resources and milestones.

Construction and Development
Gantt charts help to clearly plan construction phases, control deadlines and coordinate the work of contractors. Avoiding delays is critical in this field, so visualizing timelines and resources greatly improves project management efficiency.
Marketing and PR
Gantt charts allow you to synchronize the launch of advertising campaigns, PR-actions and content plans. They are especially useful when preparing large-scale events, where it is important to meet deadlines and coordinate the work of several departments.
Manufacturing and Logistics
They are used to plan production cycles, control capacity utilization and optimize logistics routes. They help to avoid downtime and delivery disruptions, which is especially important in tight deadlines and highly competitive environments.
Education
University professors and administrators use Gantt charts to plan curricula, scientific research and organizational activities. This makes it easier to control academic deadlines and workload distribution.
Healthcare
In medicine, Gantt charts help to coordinate the work of departments, plan repairs, equipment purchases and scientific research. They are especially useful in managing large projects, such as the introduction of new medical standards.
E-commerce and Retailing
They are used in preparing marketplaces, launching promotions and managing inventory. In a highly dynamic online sales environment, visual planning helps avoid overlaps and maximize campaign efficiency.
Best Tools for Creating Gantt Charts in Software Development
Charts are no longer just static Charts in Excel. Modern tools offer powerful features that can radically change the approach to IT project management. Let’s take a look at the key solutions and their unique features, which are rarely written about in official manuals.

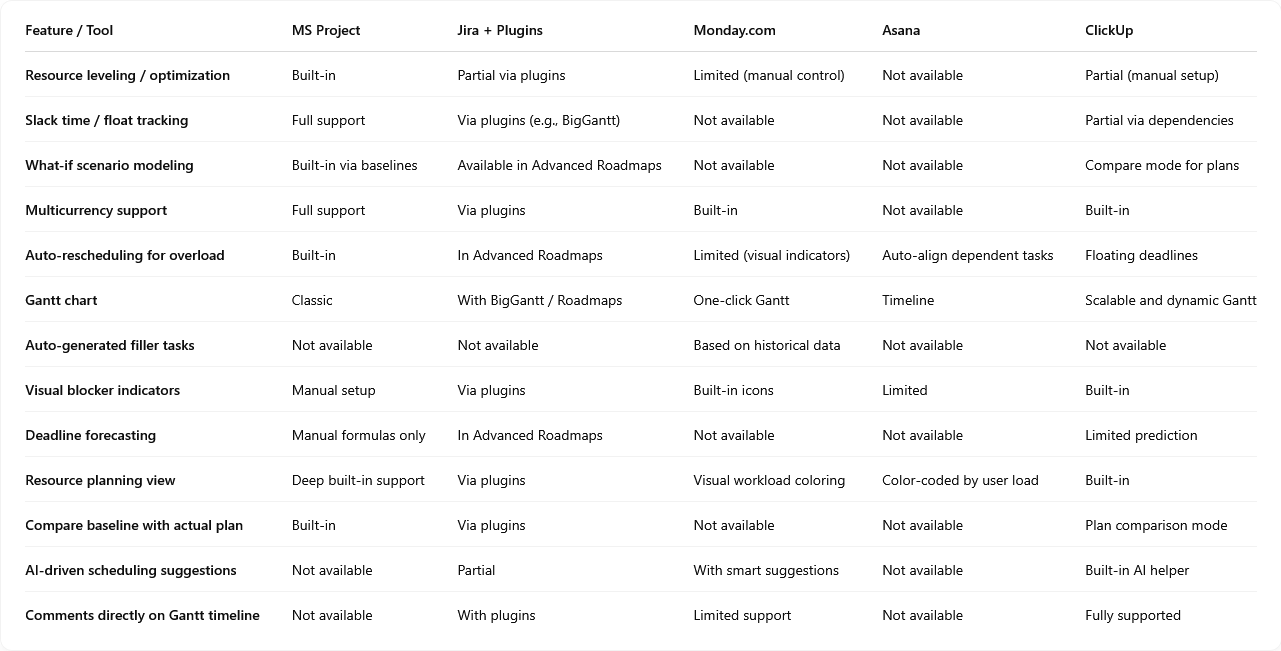
Microsoft Project — Powerful Tool for Complex Management
A classic project management tool with powerful planning capabilities. Suitable for complex IT projects with multiple dependencies and resources. Allows detailed customization of tasks, deadlines, team workload, and critical path. Minuses — high cost and complexity for beginners.
Beyond the basic functionality, MS Project hides several professional features. For example, the “Resource Saving” function automatically redistributes the load between employees when one of them is overloaded. “Slack time” (slack time) shows how much you can delay a task without affecting the project timeline. Especially valuable is the ability to model “what if” — you can test different scenarios of project development without changing the basic plan.
Jira with Plugins — Gantt Charts for Agile Purists
Just by itself, Jira doesn’t support Gantt Charts, but with plugins, it becomes a handy tool for Agile teams. Especially useful if you are already working in Jira — all tasks, sprints, and dependencies are automatically displayed in Gantt. On the downside, you need to buy plugins and visualization is not always intuitive.
Many people don’t know that in Jira you can create a “live” Chart that automatically updates as tasks move in the kanban. The BigGantt Pro plugin can visualize dependencies between epics, and Advanced Roadmaps has a unique forecasting feature — the system analyzes historical data and predicts the probability of meeting deadlines. Especially useful for Scrum masters: you can see how changing the scope of a sprint will affect the release schedule.
Monday.com — Gantt Charts that Every Team Member Can Understand
Flexible and modern Gantt Charts software with visual planning. Suitable for small to medium-sized teams. Allows you to easily drag and drop tasks, customize dependencies, and track progress. Has integrations with GitHub, Slack, and other services. Minus — limited depth of detail compared to MS Project.

In addition to standard functionality, Monday.com offers unusual ways to present data. For example, the feature to create a Gantt Chart is called “Gantt View”. To use this feature, make sure you have a Timeline Column or Date Column on your board. You can then add a Gantt view by selecting the “Gantt” option from the board views menu. This will allow you to visualize project tasks and dependencies in a Gantt Chart format.
A unique feature is the automatic creation of filler tasks for unplanned work based on historical data. The system is able to visualize blocking factors with special icons, and intelligent prompts suggest optimal schedules based on past projects.
Asana — Timeline’s Hidden Features
A simple and convenient tool for teams that don’t need complex analytics. Chart (called “Timeline” in Asana) helps visualize deadlines and dependencies, but the functionality is inferior to specialized solutions. Suitable for startups and small projects.
Many people use Asana Timeline superficially, unaware of the advanced features. For example, you can enable “Resource Planning Mode”, which shows not only deadlines but also the load of each participant by color indication. An especially useful feature is “Automatic Alignment” — when moving one task, the system suggests optimal shifts for dependent elements.
ClickUp — Next Generation Gantt Charts
A versatile tool with a good balance between simplicity and functionality. Built-in Gantt Chart allows flexible management of tasks, resources, and deadlines. There is automatic alignment of deadlines when the plan changes. Suitable for any sized IT team.
ClickUp offers several unique features: “Dynamic Zoom” allows you to go from a detailed day to a yearly overview with a single mouse movement.
The “Floating Deadlines” feature automatically adjusts deadlines when dependent tasks change.
Especially valuable is the “Compare Mode” — you can overlay the current plan on the original one and immediately see the differences. For distributed teams, built-in commenting right on the timeline may be useful.
Choosing the Best Tools for Working with Gantt Charts
When organizing the workflow using Charts, it is very important to choose the right tool, which should correspond to the specific project tasks and peculiarities of the team’s work.
Hidden and Advanced Capabilities in Project Management Platforms
For projects that require an integrated approach to project management software, Microsoft Project remains the undisputed leader. Its powerful functionality is especially in demand when working with complex work breakdown structures and the need to create templates for repetitive projects.
For teams working with Agile methodologies and actively using Gantt Charts, Jira with the Advanced Roadmaps plugin is the optimal solution. This combination allows not only to automate the process of forecasting deadlines but also to effectively manage key project milestones by quickly adapting the Gantt Chart work schedule to the changing project scope.
When visibility and ease of visualization are a priority, Monday.com is the tool to consider. This tool offers an intuitive interface that makes managing your projects much easier for non-technical teams.
For startups and small teams with a limited budget, a good option is ClickUp, which provides a basic set of functions for working with Gantt Charts without additional costs. Although its capabilities are somewhat inferior to professional solutions, it is quite capable of handling the basic tasks used in project management.
Best Practices for Using Gantt Charts in Software Development
For Charts to really help with project activities, it’s important not just to draw them, but to adapt them to the dynamics of software development. Here are proven practices that will make them useful, not just a pretty visual project.
Time and Resource Optimization
Use a Gantt Chart to identify bottlenecks in the project. Regularly analyze the distribution of tasks among developers — if one specialist is overloaded and another has spare capacity, this is a reason to redistribute the load.
Keep an eye on the major tasks that determine the project schedule — if they get delayed, all deadlines will suffer. Prioritize them first. To estimate time more accurately, use data from past Gantt Chart examples — some services (e.g. Jira with add-ons) can automatically suggest realistic deadlines based on previous work.
Flexibility and Customization of the Plan
In IT projects, change is the norm, not the exception. A Chart should not be a static document. Regularly update task statuses, make quick adjustments when requirements change, and review dependencies between stages.
If deadlines shift, use the auto-align feature (available on Monday.com and ClickUp) to see at a glance how it will affect the overall project plan.
It’s important to keep a balance — too frequent changes can disorient the team, so only capture meaningful adjustments.
Integration with Agile/Scrum Methodologies
Many people wrongly consider the tool for waterfall projects only (classical, cascade model). In practice, they can be used effectively in Agile projects as well.
Link the diagram to the sprints — each iteration becomes a separate block on the timeline. In Jira, this can be done via plugins (e.g. BigGantt) that automatically synchronize data from the backlog.
Do not try to detail all tasks in the Gantt for several sprints ahead — leave room for maneuvering, fixing only the main stages and dependencies.
By following these practices, you will turn formal planning into an effective IT project management mechanism.
Make It Easy: Why Gantt Charts Remain Essential for Project Management
Despite the common belief that Gantt charts are used only in waterfall projects, they can be no less effective in agile development methodologies. The main thing is to use them correctly.

Visualizing tasks on a timeline helps the entire team, including non-technical people, to quickly understand the percent complete and dependencies between tasks.
You can see at a glance which milestones are critical and how a delay in one area of work will affect the overall timeline. In addition, modern tools make it easy to adapt the diagram to changes in shift start and end dates, making it a handy tool even under conditions of uncertainty.
The key is not to turn it into a formal report but to use it as a living planning tool that is regularly updated as the project evolves.
How to make a Gantt Chart: Basic Steps
- Break the project into tasks — for example: “Design → Layout → API → Tests”.
- Identify dependencies — what can’t be started until another is finished (e.g., tests after development).
- Estimate deadlines — realistically, with room for revisions.
- Put people in charge — who is responsible for what.
- Visualize in a tool — Jira, MS Project, or Monday.com for simple projects.
- Update regularly — if deadlines shift, adjust the Gantt Chart schedule immediately.
Important: Keep it simple! For small Agile teams, a simple, uncluttered version will suffice.