Unlocking the full potential of your CAD data analysis with LiveCharts
SCAND delivers purpose-built software solutions for manufacturing organizations. To view, manage, and investigate product data, we offer easy-to-use CAD visualization software, data discovery tools, CAD viewers, and dynamic dashboards.
Interactive CAD data analysis contributes to the prompt making of smarter decisions that can directly impact the bottom line. With the help of our solutions, customers can easily combine data from multiple sources, perform investigative functions, and gain insight into well-considered decisions. Combining CAD model data with additional metadata and exploring their relationships and associated files among other tools for viewing, comparing, and validating data will reduce errors and mitigate risks.
Since CAD model data presenting may seem a cumbersome task, we have been analyzing the available solutions and looking for the best way to transform the collected raw data into interactive, insightful, and valuable information. The suitable option should be open source and run under a license free for the commercial use with very little limitations. We also considered some positive examples of integrating the third-party library to our solution.
From our development experience and based on the analysis made, we endorse a LiveCharts data visualization library as a right tool for CAD model data visualization. The library is open source, and it runs under the MIT license, which means you can do practically whatever you need with the source code. The LiveCharts’ repository is available on Github and contains a bunch of examples. It is easy to find a LiveCharts NuGet package for the selected platform (WPF, WinForms, or UWP) and integrate it to your project in Visual Studio.
LiveCharts: benefits
- LiveCharts is designed as being easy to use and implement.
- When CAD data are updated, the charts are automatically animated.
- The LiveCharts library will update only in case the changes are necessary, but not after any data fluctuations. If you add/remove series or values, the chart will update on its own.
- LiveCharts supports Material, Metro, Blue, White, and Black themes and provides the ability of theme customization.
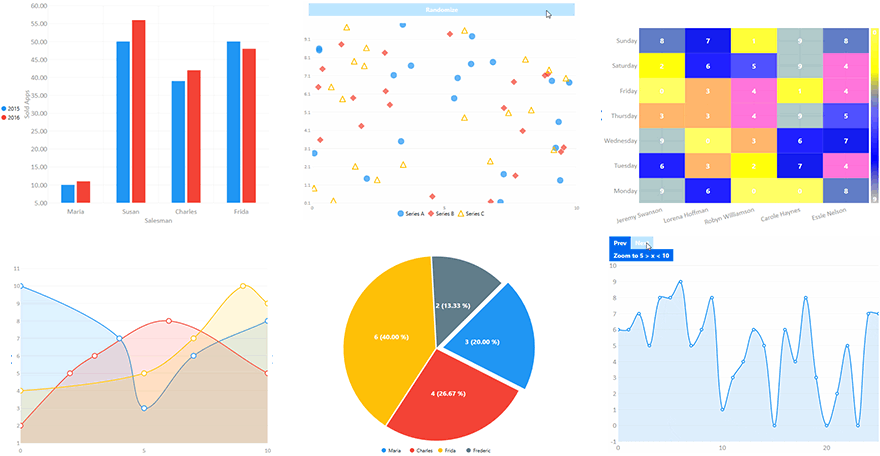
LiveCharts visualizes data as animated charts of all sorts which are represented below:

While working on our solutions, we have highly evaluated LiveCharts’ flexibility, interactivity, and capacity to visualize significant volumes of CAD data. So, there is no need to worry and spend time on anything but CAD data analysis — LiveCharts will deal with charting!
Our software development team’s expertise includes the design of 2D and 3D CAD software solutions with intuitive Graphical User Interface that helps to view, measure, mark up, and analyze CAD models saved in various file formats. Being an open-source library, LiveCharts easily became a part of our solution and provided powerful CAD model data visualization via the diverse chart types. We’ll be glad to assist you with your CAD data analysis and data visualization projects.


